News +++ News +++ News +++ News +++ News
Map of the month April 2024: Ratio between live births and deaths
In April we take a look at the ratio between live births and deaths, which is an important factor of population development besides migration. Green areas mark municipalities with more live births than deaths. You can see that these areas mainly concentrate in around the big cities and along the major traffic routes. The map is available through our geoportal map.centropemap.org.
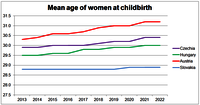
Chart of the month March
March is the month of women. This month we therefore take a look at figures on the average age of women at the time of childbirth in the four Centrope countries Austria, Czech Republic, Hungary and Slovakia. The chart shows similarities in the development of the indicator over time in all four countries. Women are giving birth later and later. In Slovakia, this trend is only weakly recognisable, but in the other three countries it is clear and increasing to roughly the same extent. At the same time, the average age of women at the time of childbirth is also significantly lower in Slovakia. Later births may be a factor contributing to the fall in birth rates; this phenomenon can be observed in all Centrope countries. Data source: ec.europa.eu/eurostat/databrowser/view/nrg_ind_ren/default/table
Did you know?
There are three underground networks in the Centrope countries. The first underground line was opened in 1896 in Budapest (already electrified, at this time tramcars were still pulled by horses in Vienna!). Today Budapest runs 4 underground lines with 52 stations in total. The second oldest underground network in the Centrope countries is Prague's metro which opened in 1974. It consists of 3 lines with 61 stations. The youngest underground network in Centrope is Vienna's underground (opened in 1978) with 5 lines and 89 stations. Slovakia does not have an underground network.
Source: Wikipedia
Overview
CentropeMAP/STATISTICS is a cross-border information system and free geoportal of the Austrian Planning Association East (PGO) which gives planners, decision makers, researchers, teachers, students and everyone else interested a better overview of the Centrope region.
CentropeMAP is a geoportal connecting the region by collecting web map services from the partner countries. The services are brought together in a single map viewer and allow the user to experience a cross-border working area with dozens of data layers dealing with all topics which could be of interest for regional planners and similar professions. Layers are coming from the fields of biota, boundaries, elevation, imagery/base maps, inland waters, planning/cadastre, structure, and transportation.
CentropeSTATISTICS is the only available free web tool to visualise cross-border statistical data in its own connected geoportal allowing the user to influence the way of visualisation in multiple ways in the Centrope region. CentropeSTATISTICS can not only create maps, it also serves charts which are interactively created from the data in the cross-border database. For the Czech Republic, CentropeSTATISTICS does not only cover the Centrope county Jihomoravský, but also features data from the counties Vysočina and Jihočesky which are also adjacent or close to the Austrian border.
CentropeMAP and CentropeSTATISTICS Info Folder
- Download of German version (PDF, 3 MB)


![[Translate to Slovensko:] Centrope region [Translate to Slovensko:] The centrope region](fileadmin/_processed_/8/c/csm_centroperegion_092d49382d.png)
![[Translate to Slovensko:] CentropeMAP [Translate to Slovensko:] CentropeMAP screenshot](fileadmin/_processed_/b/8/csm_cmap_46e6042f38.png)
![[Translate to Slovensko:] CentropeSTATISTICS [Translate to Slovensko:] CentropeSTATISTICS screenshot](fileadmin/_processed_/a/1/csm_cstat_3e02e94659.png)