
News
The tables of the CentropeSTATISTICS cross-border database were updated recently:
- Population by sex and year (1970/71-2025)
- Population by year (data 1970/71-2025)
- Population density (inhabitants per square kilometre) by year (data 2001-2025)
- Population Indicator: Migration Balance since 2002 (data 2002-2024)
- Immigration, emigration, migration balance (absolute) (data 2010-2024)
- Population by five-year age groups, total (data 2008-2025)
- Population by five-year age groups, female (data 2008-2025)
- Population by five-year age groups, male (data 2008-2025)
- Population Indicators (age groups, data 2008-2025)
- Population: Births and Deaths by year (data 2002-2024)
- Number of deaths by period and territory (data 2002-2024)
- Number of births by period and territory (data 2002-2024)
- Population Indicators: Population Change by year (data 2001-2025)
Also, the Predefined Thematic Maps and Centrope in Figures were updated accordingly.
Üdvözöljük a CentropeMAP-on!
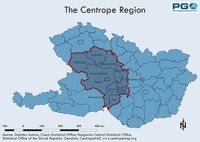
A CentropeMAP az Osztrák Tervezési Szövetség Kelet (PGO) határokon átnyúló geoportálja, amely a tervezők, döntéshozók, kutatók, tanárok, diákok és minden más érdeklődő számára jobb áttekintést nyújt a Centrope régióról.
A CentropeSTATISTICS a geoportál hatékony kiegészítője, amely lehetővé teszi a felhasználók számára, hogy néhány egérkattintással térképeket, diagramokat és animált grafikákat hozzanak létre a települési szintű statisztikai adatokból.
*) Nem működik megfelelően? Állítsa be a pop-up blokkolót úgy, hogy az ne akadályozza meg a www.centropemap.org webhelyet abban, hogy új ablakot nyisson meg a böngészőjében.
 Map of the month September
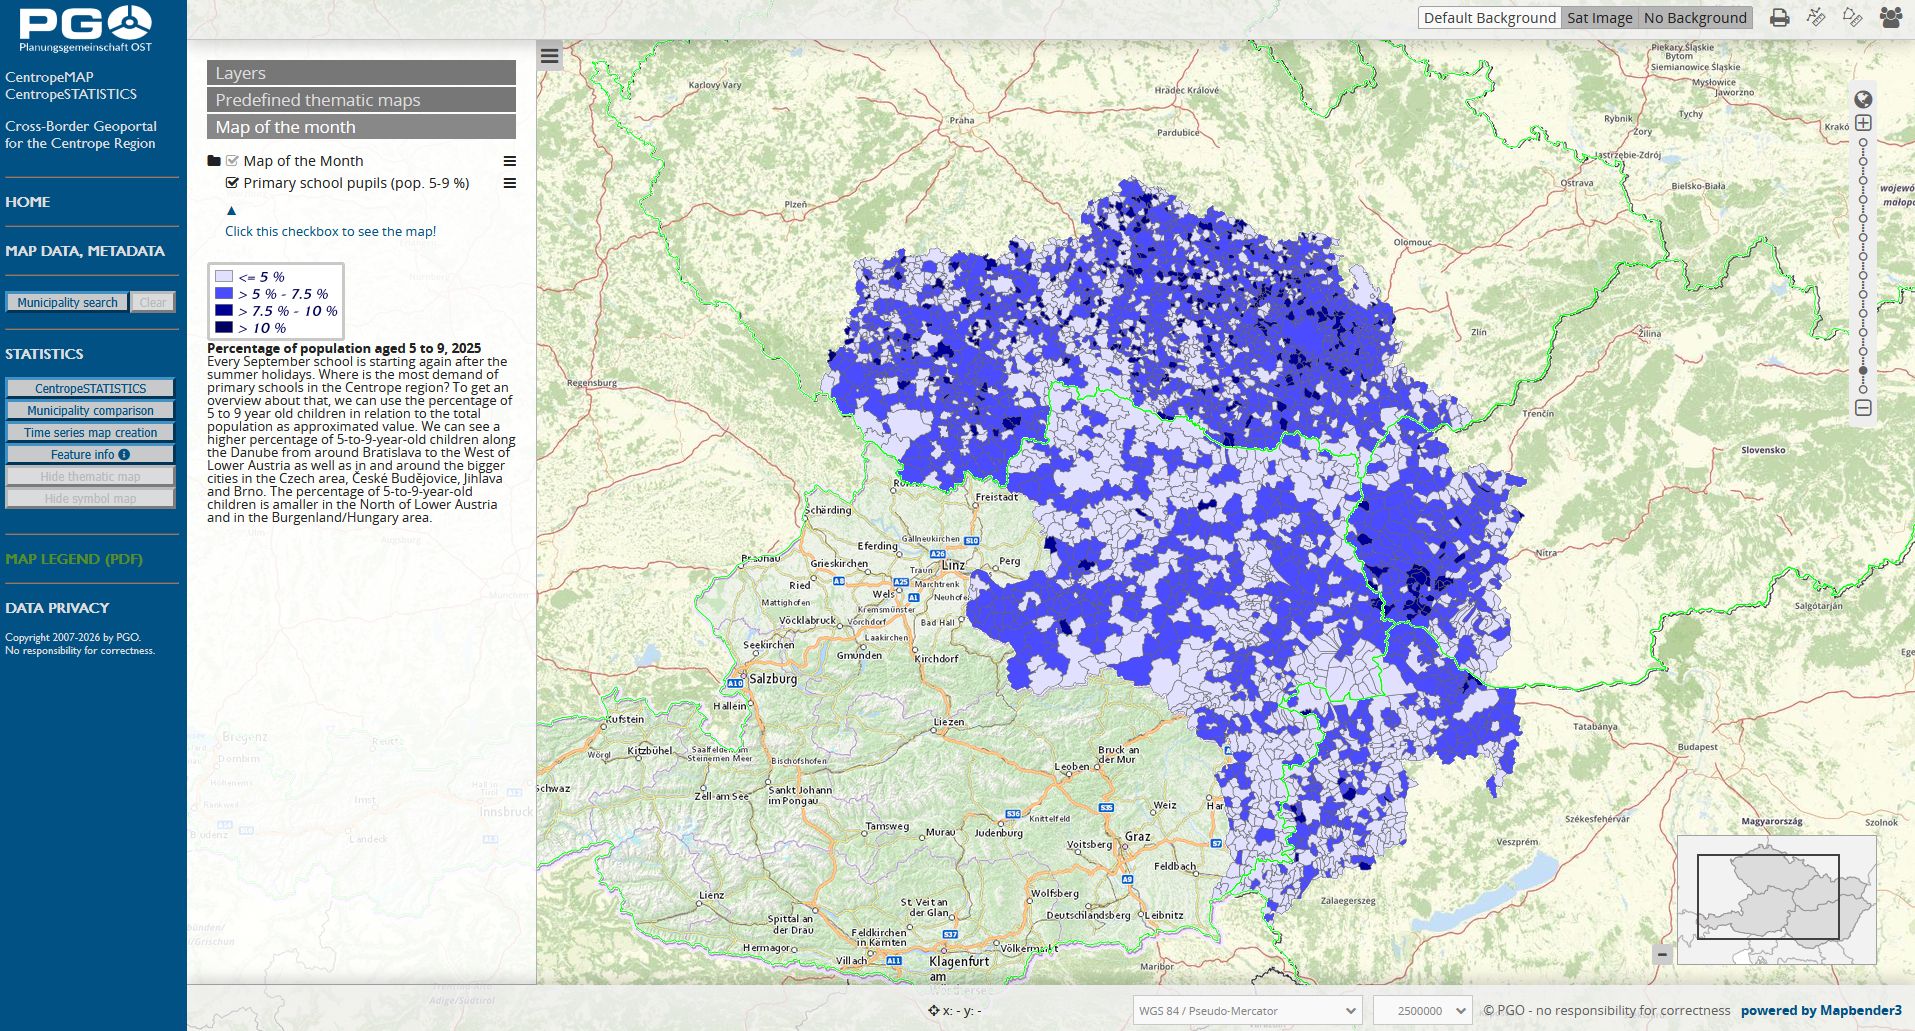 Every September school is starting again after the summer holidays. Where is the most demand of primary schools in the Centrope region? To get an overview about that, we can use the percentage of 5 to 9 year old children in relation to the total population as approximated value. We can see a higher percentage of 5-to-9-year-old children along the Danube from around Bratislava to the West of Lower Austria as well as in and around the bigger cities in the Czech area, České Budějovice, Jihlava and Brno. The percentage of 5-to-9-year-old children is amaller in the North of Lower Austria and in the Burgenland/Hungary area. The map is available through our geoportal map.centropemap.org
Open our geoportal map.centropemap.org to view this map.
Chart of the month August
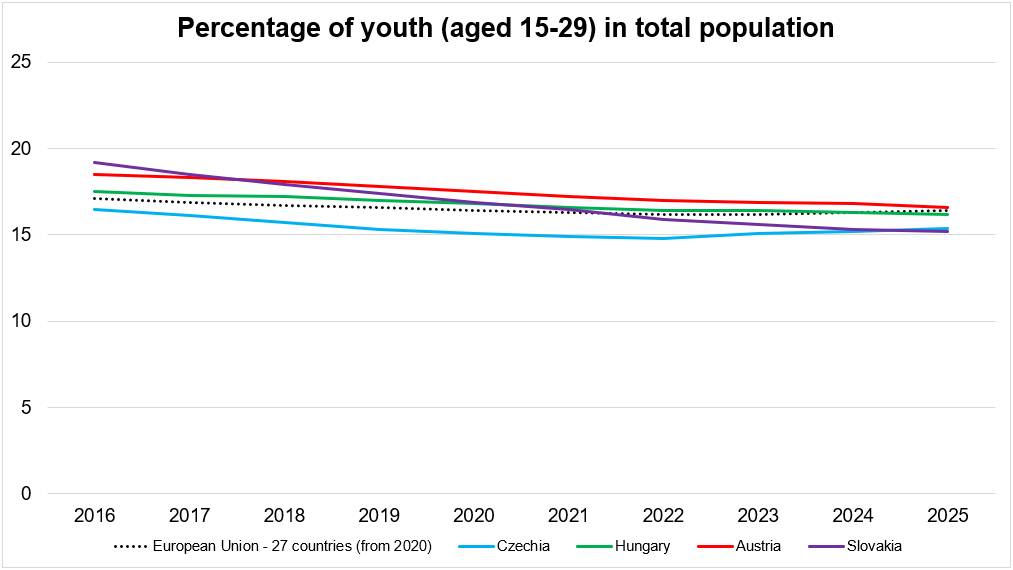 On the occasion of International Youth Day, celebrated on 12 August, we are taking a look at the development of the youth ratio in Centrope's population, displayed as percentage of people aged 15 to 29 years. The chart shows an overall decrease during the last 10 years in all Centrope countries as well as in the EU-27 average – except the Czech Republic, where the youth ratio is rising again since a few years. The trend is generally pointing towards a flatter curve, which means that the decrease of youth population is slowing down.
Data source: https://ec.europa.eu/eurostat/databrowser/view/demo_pjangroup/default/table
On the occasion of International Youth Day, celebrated on 12 August, we are taking a look at the development of the youth ratio in Centrope's population, displayed as percentage of people aged 15 to 29 years. The chart shows an overall decrease during the last 10 years in all Centrope countries as well as in the EU-27 average – except the Czech Republic, where the youth ratio is rising again since a few years. The trend is generally pointing towards a flatter curve, which means that the decrease of youth population is slowing down.
Data source: https://ec.europa.eu/eurostat/databrowser/view/demo_pjangroup/default/table
 Map of the month August
Chart of the month July
CentropeMAP and CentropeSTATISTICS Info Folder
- Download of German version (PDF, 1.7 MB)