
Welcome to CentropeMAP!
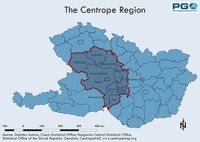
CentropeMAP is a cross-border geoportal of the Austrian Planning Association East (PGO) which gives planners, decision makers, researchers, teachers, students and everyone else interested a better overview of the Centrope region.
CentropeSTATISTICS is a powerful extension of the geoportal allowing its users to create maps, charts and animated graphics from statistical data on municipality level with a few mouse clicks.
*) Does not work properly? Adjust your pop-up clocker so that it does not prevent www.centropemap.org from opening a new window in your browser.
 Chart of the month October
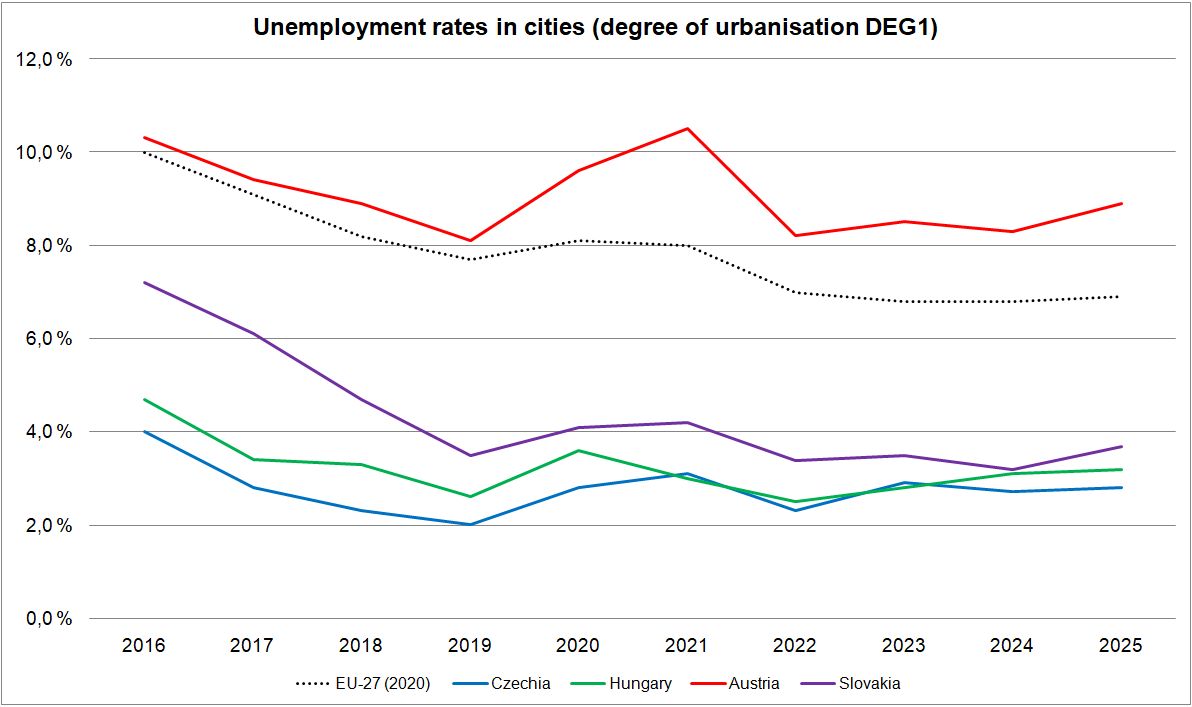 On the occasion of International Cities Day, celebrated on 31 October, we are taking a look at the development of the unemployment rate (population aged 15 top 64) in cities in the Centrope region. The chart shows a downward trend in the EU average; however, this trend appears to have reversed again over the last two years. It is interesting to note that the COVID-19 slump (2020–2021) was far more pronounced in Austria than in the other countries. This could be because the tourism sector is more prominent in the Austrian Centrope cities than in the Czech Republic, Hungary and Slovakia.
Data source: https://ec.europa.eu/eurostat/databrowser/view/lfst_r_urgau__custom_23381407/default/table
On the occasion of International Cities Day, celebrated on 31 October, we are taking a look at the development of the unemployment rate (population aged 15 top 64) in cities in the Centrope region. The chart shows a downward trend in the EU average; however, this trend appears to have reversed again over the last two years. It is interesting to note that the COVID-19 slump (2020–2021) was far more pronounced in Austria than in the other countries. This could be because the tourism sector is more prominent in the Austrian Centrope cities than in the Czech Republic, Hungary and Slovakia.
Data source: https://ec.europa.eu/eurostat/databrowser/view/lfst_r_urgau__custom_23381407/default/table
Map of the month October
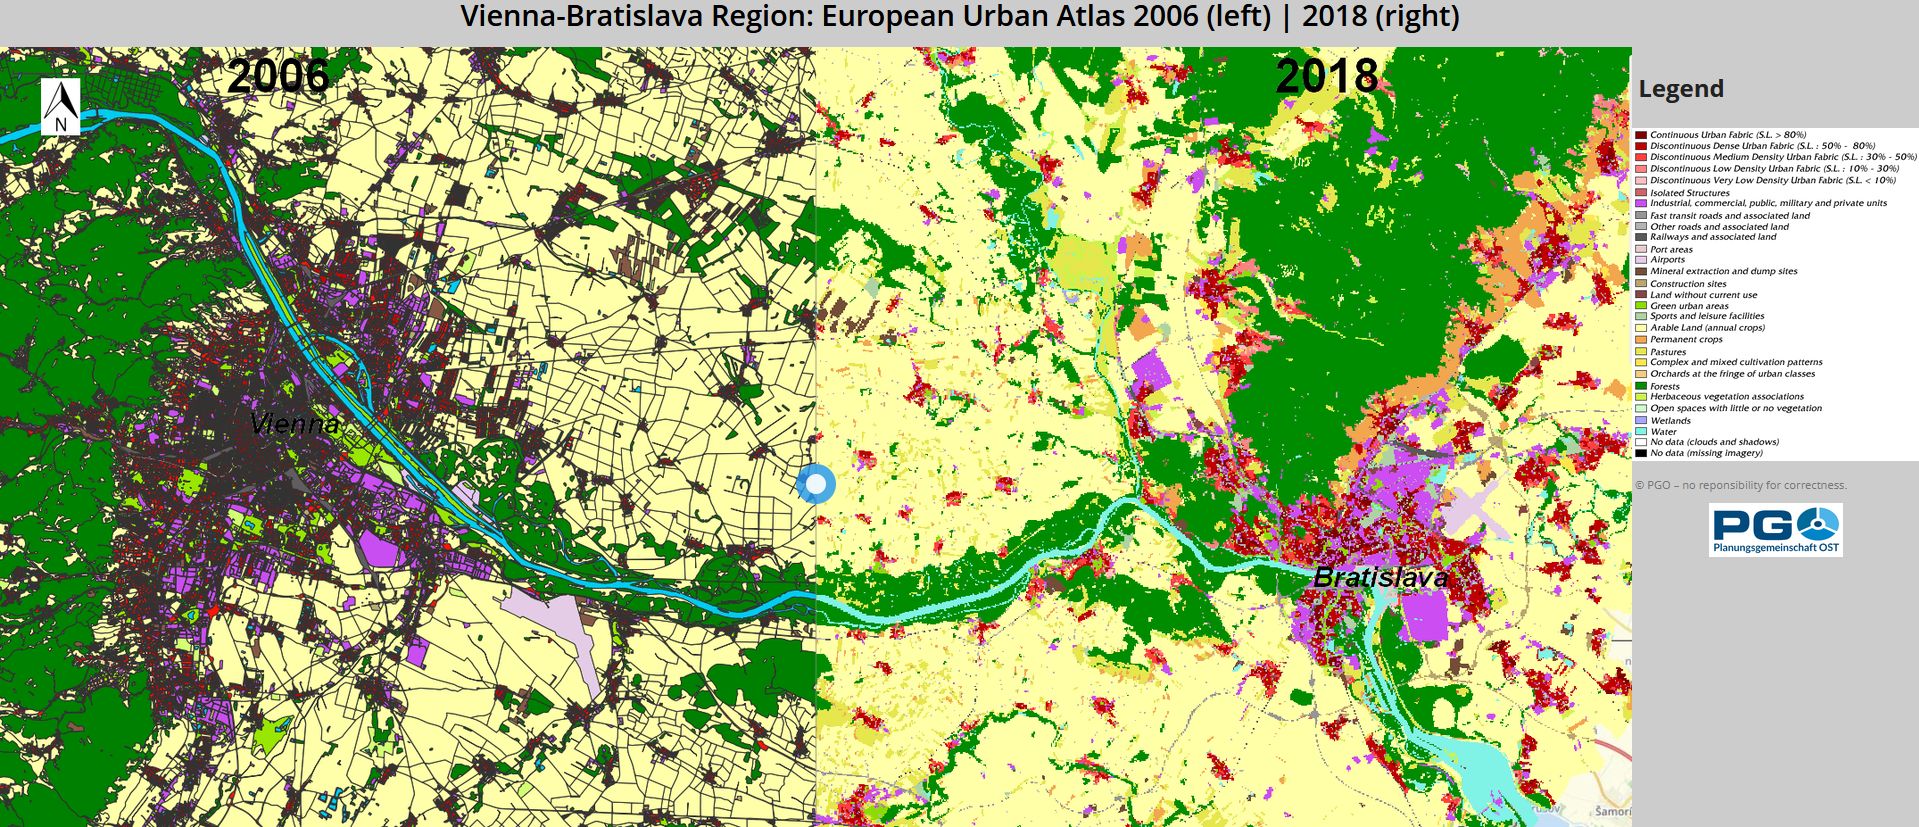 In 1900, there were 1.6 billion people on Earth; today, that number has already reached 7 billion. Of these, 54 percent currently live in cities. By 2030, the number of city dwellers is expected to reach 5 billion. However, this so-called urbanization also brings its own set of problems. Cities offer opportunities for sustainable development, but at the same time, they are also risky places to live. 31 October is World Cities Day. On this occasion we are taking a look at the land us in urban agglomerations comparing the European Urban Atlas from 2006 and 2018.
Open Map for Vienna-Bratislava region
Open Map for Győr region
Open Map for České Budějovice region
Open Map for Brno region
 Chart of the month September
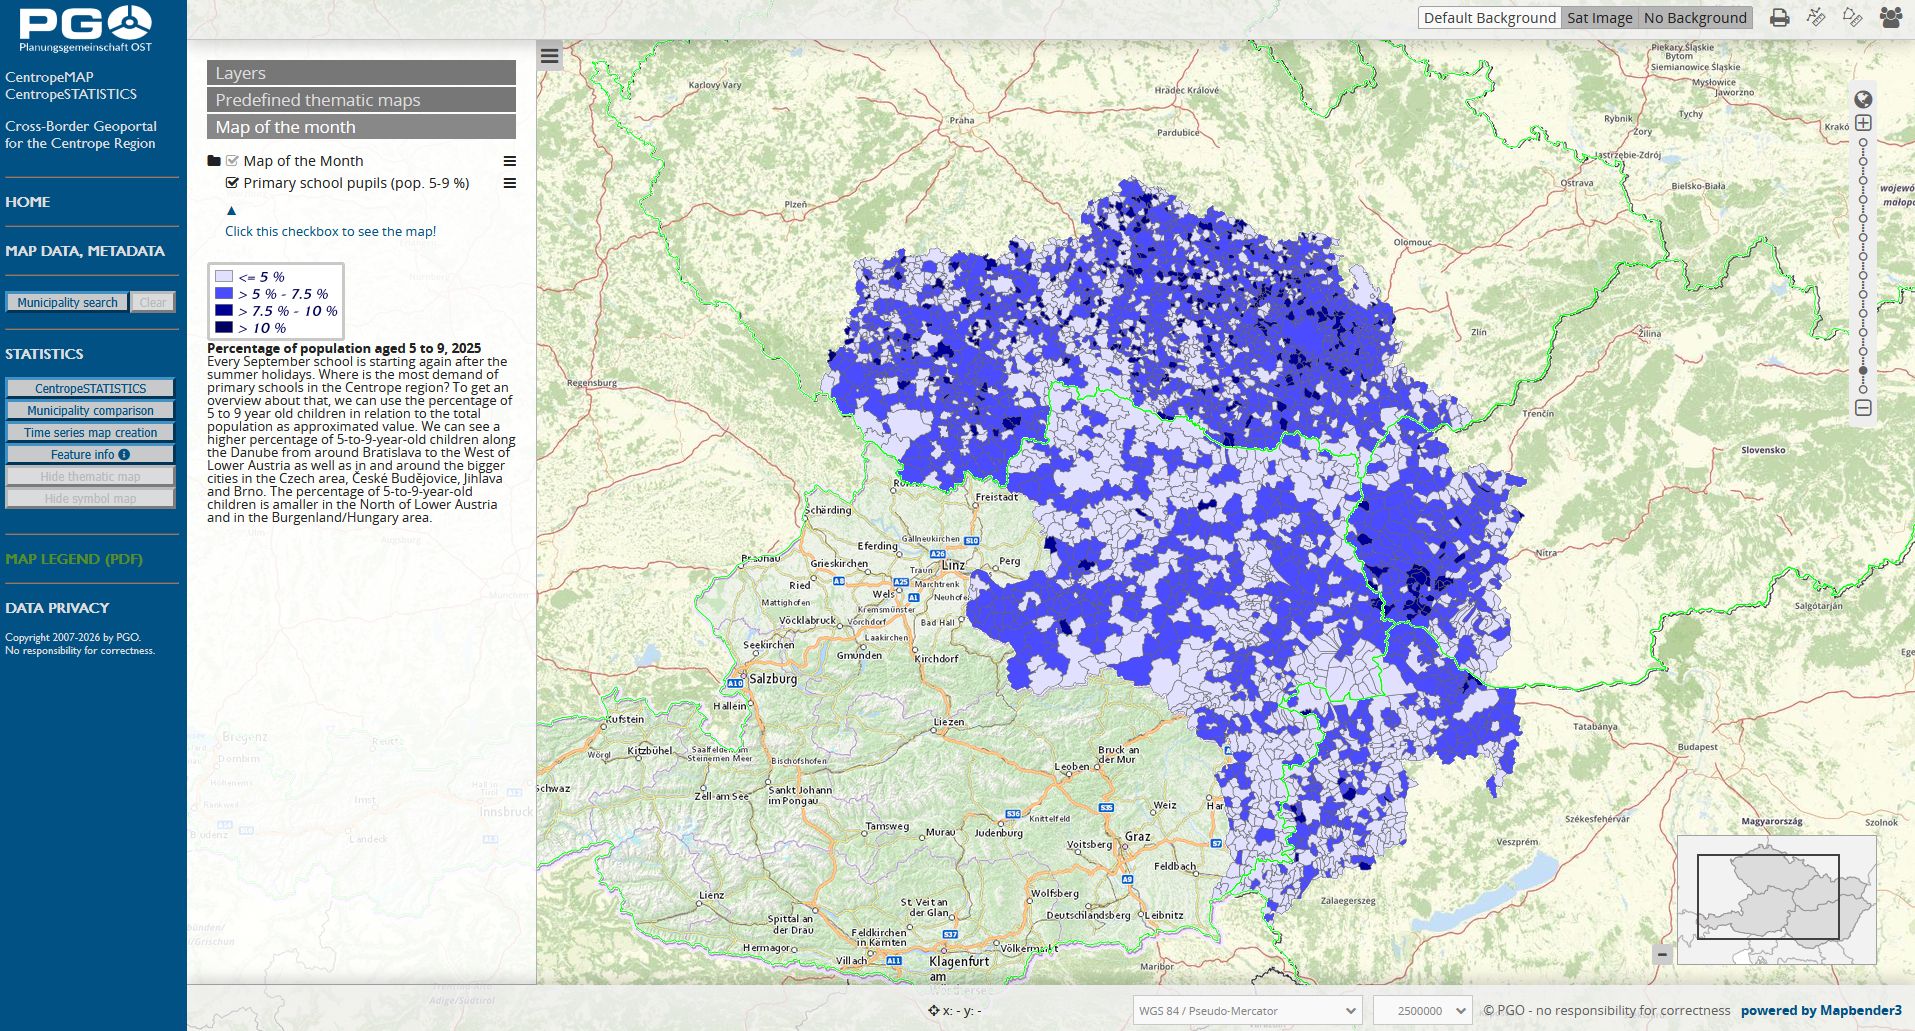
Map of the month September
CentropeMAP and CentropeSTATISTICS Info Folder
- Download of German version (PDF, 1.7 MB)